Why New Listings Skew Rent Data (And How to Adjust for It)
When rent numbers look higher than you expected, the usual culprit is the dataset: most rent data is dominated by new listings. Listings are useful, but they're asking prices — not what tenants actually signed for.
Understanding that skew — and correcting for it — keeps you from overpricing into a vacancy.
Why listings dominate rent data
Most platforms lean on active listings because they're easy to collect and update in real time. But a listing is asking rent, not executed rent:
- Landlords price optimistically when they list
- Renovated and premium units are overrepresented
- Overpriced units sit longer, so they pile up in the data
The result is a dataset tilted toward the top of the market.
Recency is the fix — so look at it directly
The single best defense is checking how recent each comp is. A good comp set shows it per row:
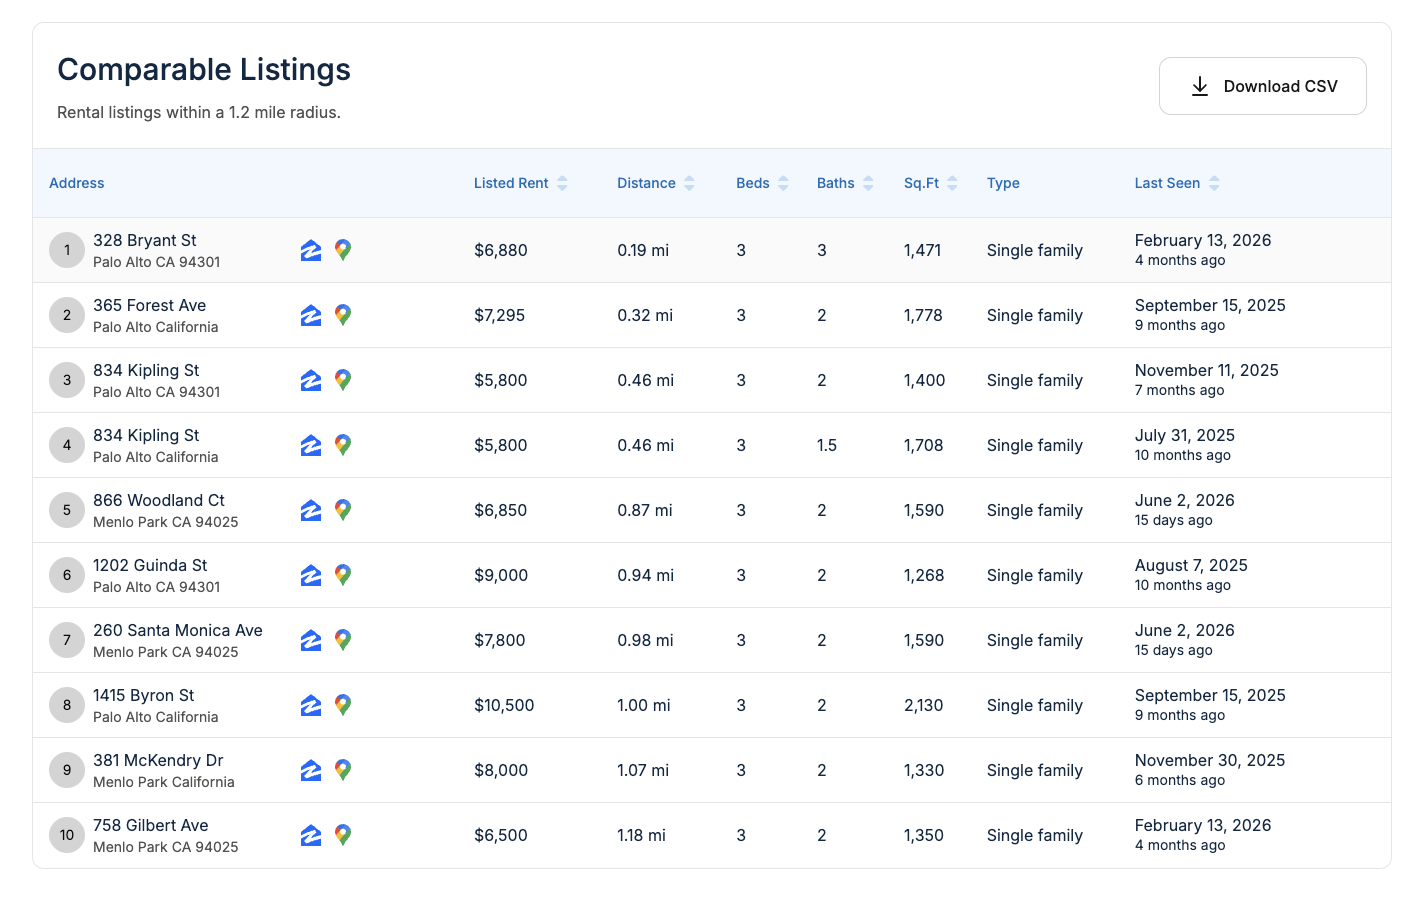
A $2,400 listing that's been up for months is a weaker signal than a unit seen last week. Weight the recent, leased-looking comps — not the stale, aspirational ones.
What each data source actually reflects
| Data source | What it reflects | Typical bias |
|---|---|---|
| Active listings | Asking rent | Overestimates the market |
| Recently rented | Signed leases | Most accurate |
| Long-term tenancies | In-place rents | Underestimates current market |
Why median helps but isn't enough
Median rent reduces outlier impact, but it can't save a dataset that's mostly listings. If 70–80% of comps are new listings, the median still reflects listing behavior, not lease behavior — which is why two tools show different medians for the same block.
How to adjust for the skew
- Separate listings from leases. Compare asking prices against recently rented units — that $2,400 ask may have leased at $2,250.
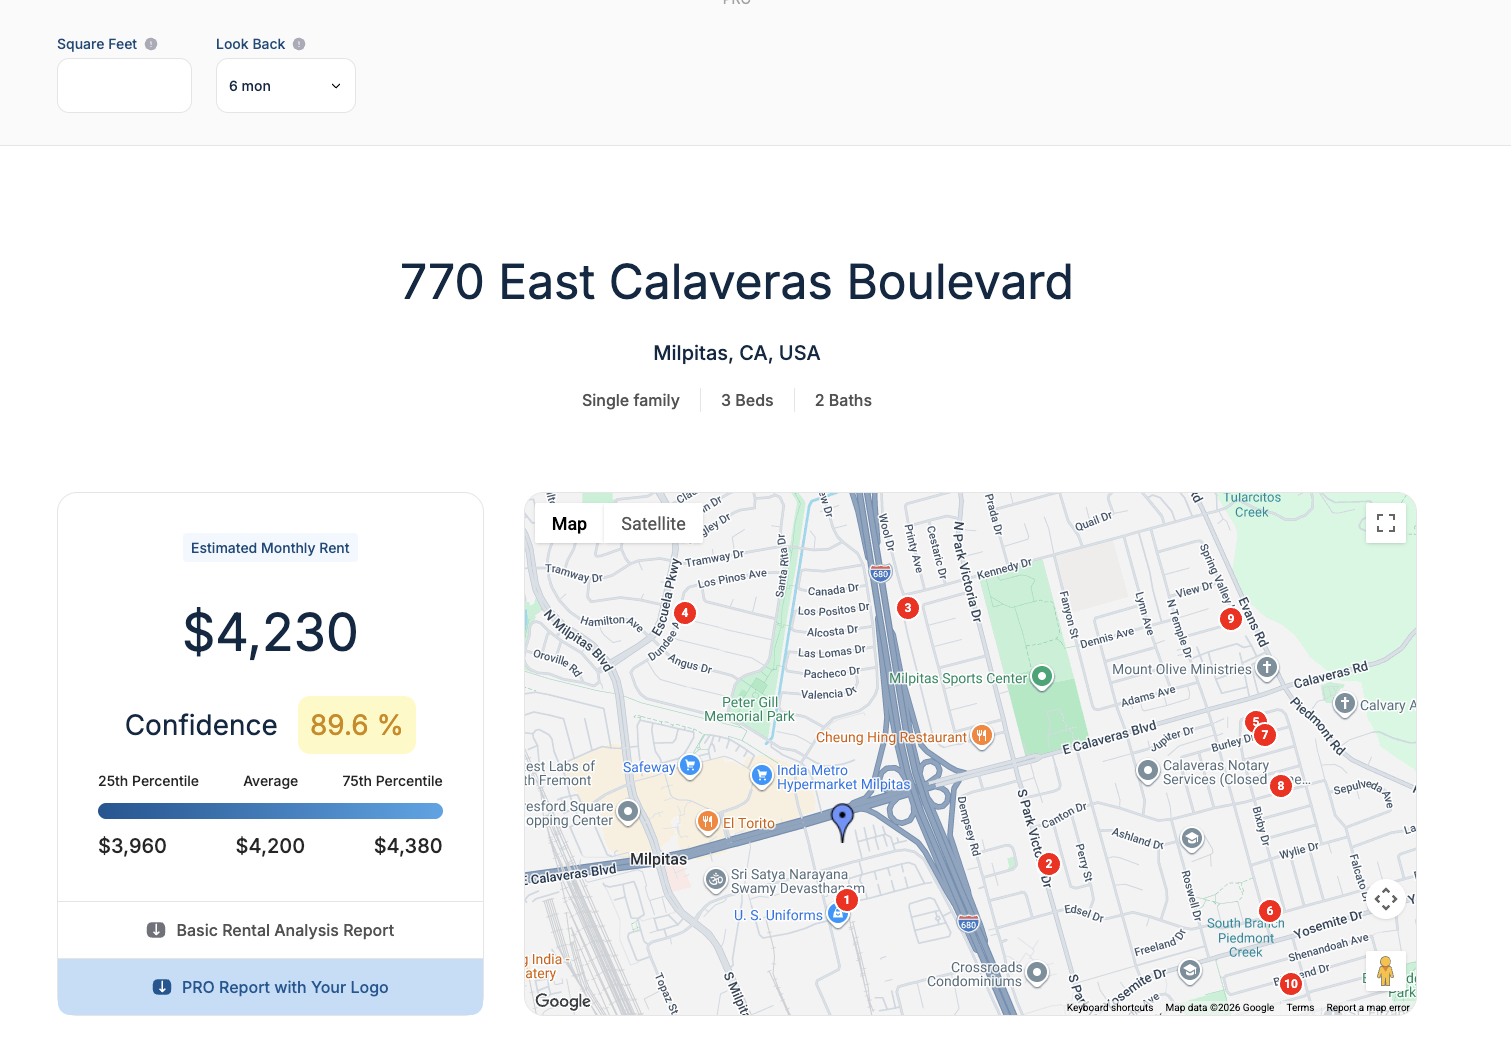
- Use percentile ranges. Look at the 25th / 50th / 75th to see where aggressive listings sit versus the broader market.
- Apply a look-back window. Widening to 6–12 months smooths out short-term, seasonal, or speculative spikes.
That last one is a control you can set directly:
- Filter by similarity. New listings skew newer and renovated — match age, size, and type to cut structural bias.
When new listings are still useful
Listings earn their keep when you're pricing a fully renovated or premium unit, inventory is extremely tight, or you're deliberately testing the top of the market. The trick is knowing when a listing represents reality versus ambition.
The takeaway
New listings overstate market rent, especially in cooling markets. The reliable estimate blends listings with real lease behavior, a longer look-back, and percentile analysis. Pricing with context beats pricing with hope.
Run an estimate with adjustable recency on RentEst.ai →
Frequently asked questions
Why do rent estimates change so fast? Listings update daily and dominate datasets, so small inventory shifts swing the number.
Is asking rent the same as market rent? No. Asking rent is seller intent; market rent is what tenants actually pay.
Should I ignore new listings? No — just adjust expectations with historical and percentile data.
What's the best single number to use? There isn't one. A range anchored on the median is more reliable.